
Your Practice Has a Strategy Problem,
Not a Patient Problem.
The average dental practice accepts 31% of presented treatment. High-performing practices accept 68%. The gap is not clinical — it is operational.
Average case acceptance rate across US dental practices
Median annual revenue left uncaptured per solo practitioner
Case acceptance rate in practices with engineered workflows
Three Practices. Three Different Problems.
One Pattern of Diagnosis.
The revenue constraint in a dental practice is rarely what it appears to be on the surface. These engagements illustrate the diagnostic process — and what changes when the right lever is identified.
Measurable Outcomes
Annual production recovered
Case acceptance (from 34%)
Hygiene reappointment rate
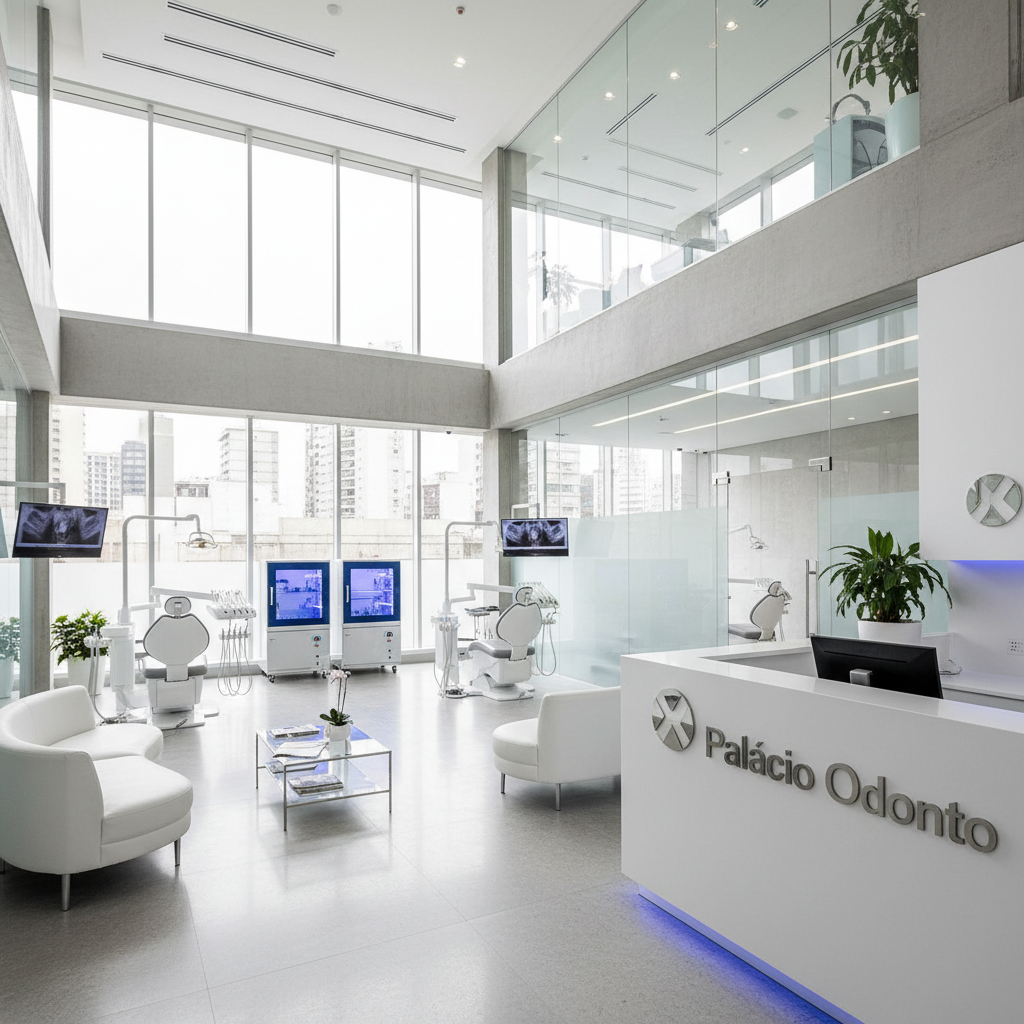
A general dentistry practice billing $820K annually had plateaued for three consecutive years. The owner-dentist attributed the stagnation to market saturation and insurance mix. New patient flow was adequate. Production per visit was not.
Within the first week, a schedule audit revealed that 22% of hygiene chair time was consumed by recare appointments that had not been converted to active treatment in over 14 months. The hygiene reappointment rate was 71% — functional, but masking a systemic breakdown in how diagnosed treatment was being presented and followed up.
We rebuilt the morning huddle protocol to surface unscheduled treatment before each day opened. The front desk workflow was restructured so that every patient leaving with open treatment had a next-appointment offer before reaching the door — not a reminder call three weeks later. We introduced a same-day treatment acceptance track for single-surface restorations under $400 and trained the clinical team on a four-sentence case presentation sequence.
$180K in annual production recovered within two treatment cycles. Hygiene reappointment rate moved to 84%. Case acceptance on presented comprehensive treatment increased from 34% to 61% in 90 days.
Does this engagement resemble your practice? The diagnostic framework maps the same variables.
Get the Framework
Measurable Outcomes
Additional collections, Year 1
EBITDA restored (from 16%)
Patient retention through transition
A regional DSO with six locations was generating $6.2M in annual collections but watching EBITDA compress from 22% to 16% over 18 months. Leadership had attributed the margin erosion to labor costs and supply chain. The fee schedule had not been reviewed in four years.
A cross-location fee audit against Delta, Cigna, and Aetna UCR benchmarks revealed that four of six locations were operating at fee levels 11–18% below the 75th percentile for their zip codes. One location had not updated its crown fee since 2019. Collectively, the six practices were leaving an estimated $740K annually in legitimate, billable production on the table — not from patient volume, but from systematic underpricing.
We executed a phased fee restructuring across all six locations, sequenced to minimize patient attrition risk. High-volume codes were adjusted first, using a bracket approach that brought each location to the 70th UCR percentile within two billing cycles. We simultaneously renegotiated the two PPO contracts where the practice held sufficient volume leverage. The operations team was briefed on presenting fee increases as quality investment, not cost escalation.
EBITDA recovered to 21% within two quarters. Aggregate collections increased by $610K in year one without adding a single new patient. Patient retention held above 94% across all locations through the transition.
Does this engagement resemble your practice? The diagnostic framework maps the same variables.
Get the Framework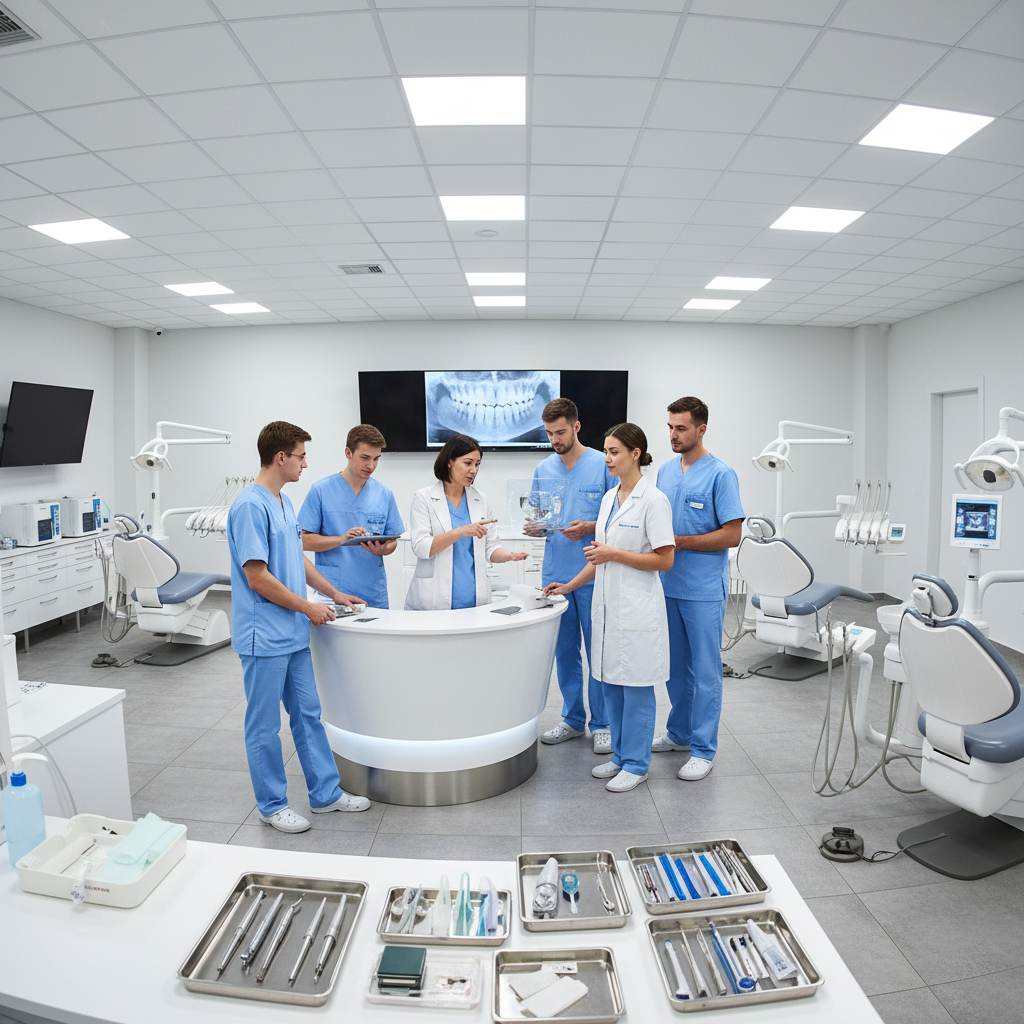
Measurable Outcomes
Total production (from $2.1M)
Production per provider increase
Managing dentist share (from 60%)
A practice with four associates and a managing dentist was billing $2.1M annually — respectable on paper. But production per provider had declined 19% over two years as the associate roster grew. The managing dentist was producing 60% of total revenue. Three of four associates were generating below the breakeven threshold for their compensation structure.
The scheduling system was operating as a single-queue model — all new patients routed to the first available provider regardless of case complexity or fee category. High-value comprehensive cases were being assigned to associates who lacked either the clinical confidence or the case presentation experience to close them. The managing dentist was absorbing overflow because the system had no triage logic.
We implemented a tiered case routing protocol: new patient exams routed by insurance type and presenting complexity, with comprehensive cases defaulting to the managing dentist or the senior associate. We built individual production dashboards for each provider and introduced a weekly 20-minute production review that made each associate's numbers visible to the team. Two associates received targeted case presentation coaching. One associate — whose production had not improved after 60 days of structured support — was transitioned out of the practice.
Total practice production increased to $2.7M within 12 months. Production per provider increased 34% on average across the three retained associates. The managing dentist's share of total production dropped from 60% to 41% — a healthier distribution that reduced key-person dependency and improved practice valuation metrics.
Does this engagement resemble your practice? The diagnostic framework maps the same variables.
Get the FrameworkThe Practice Diagnostic Framework
The same 14-point operational audit used at the start of every engagement. It maps your practice against five revenue constraint categories: scheduling efficiency, case acceptance, fee positioning, hygiene reappointment, and production per provider.
What's inside
"I ran the fee audit section on a Tuesday afternoon and found $94K in annualized underpricing before I finished the first tab. That was a useful hour."
— Dr. Marcus Webb, Group Practice · Atlanta, GA
Schedule a Confidential
Practice Review
A 45-minute working session. You share your current production numbers, scheduling structure, and the one metric that's keeping you up at night. I tell you where the constraint is and what to do about it — no proposal deck, no follow-up sequence.
You bring three numbers
Annual collections, case acceptance rate (or your best estimate), and hygiene reappointment rate.
I identify the constraint
Within the first 20 minutes, the primary revenue constraint is identifiable in virtually every practice.
You leave with a path
Not a proposal. A specific, sequenced set of changes — starting with the one that moves the number fastest.
Limited availability. Reviews are conducted personally, not delegated. Two slots per week are held for first-time engagements. If no time works below, email directly to arrange.
Available Sessions
February 2026
Session Type
Select a Time
Zoom link sent immediately upon confirmation
Years practice consulting
Engagements completed
Production recovered across clients
States with active client engagements

Practice strategy built on operational reality,
not advisory distance.
I have spent 14 years walking into dental offices where the numbers had stopped moving and the owner had stopped knowing why. I do not work from a questionnaire. I work from the schedule, the AR aging report, the morning huddle, and the case presentation workflow — the four places where revenue is made or lost before a patient ever reaches the chair.
My clients range from solo practitioners who know they should be at $1.4M to DSO operators managing EBITDA across six or twelve locations. The diagnostic process is the same. The constraint is usually different. The work is always specific.
The constraint is almost never what the owner thinks it is.
Practices that have plateaued typically believe the problem is marketing, or insurance mix, or patient demographics. In 90% of engagements, the constraint is internal — a workflow, a pricing decision, or a handoff that has been normalized out of visibility.
Numbers tell you where to look. They do not tell you what to change.
A production dashboard shows you the symptom. The diagnosis requires understanding the workflow that produced the number — the scheduling logic, the case presentation sequence, the handoff between hygiene and restorative. That is where the work happens.
The fastest path to $1.4M is not adding patients. It is capturing the production already in the building.
Most practices operating below their potential have sufficient patient volume. They are not collecting on the dentistry already diagnosed. Closing that gap requires no marketing budget and no new equipment — it requires operational precision.